Executive Summary
As of February 7, 2026, Palantir Technologies (NYSE: PLTR) appears to have decoupled itself from the generic "GenAI" basket, establishing a distinct position within the Western industrial software stack.
While the market debates its elevated price-to-earnings (P/E) multiple, the CRITICAL MASS Valuation Model identifies a fundamental shift in the company's capital structure. The "dilution drag" that historically weighed on the equity has subsided significantly. Palantir has evolved from a cash-burning growth firm into a GAAP-profitable Operational Efficiency Driver with a robust balance sheet.
Key Finding: The current valuation demands near-flawless execution. However, our stress test suggests that Palantir's "Bootcamp" delivery model has structurally lowered Customer Acquisition Costs (CAC), creating a moat based on deployment speed rather than just proprietary code.
1. The Dilution Trend Analysis
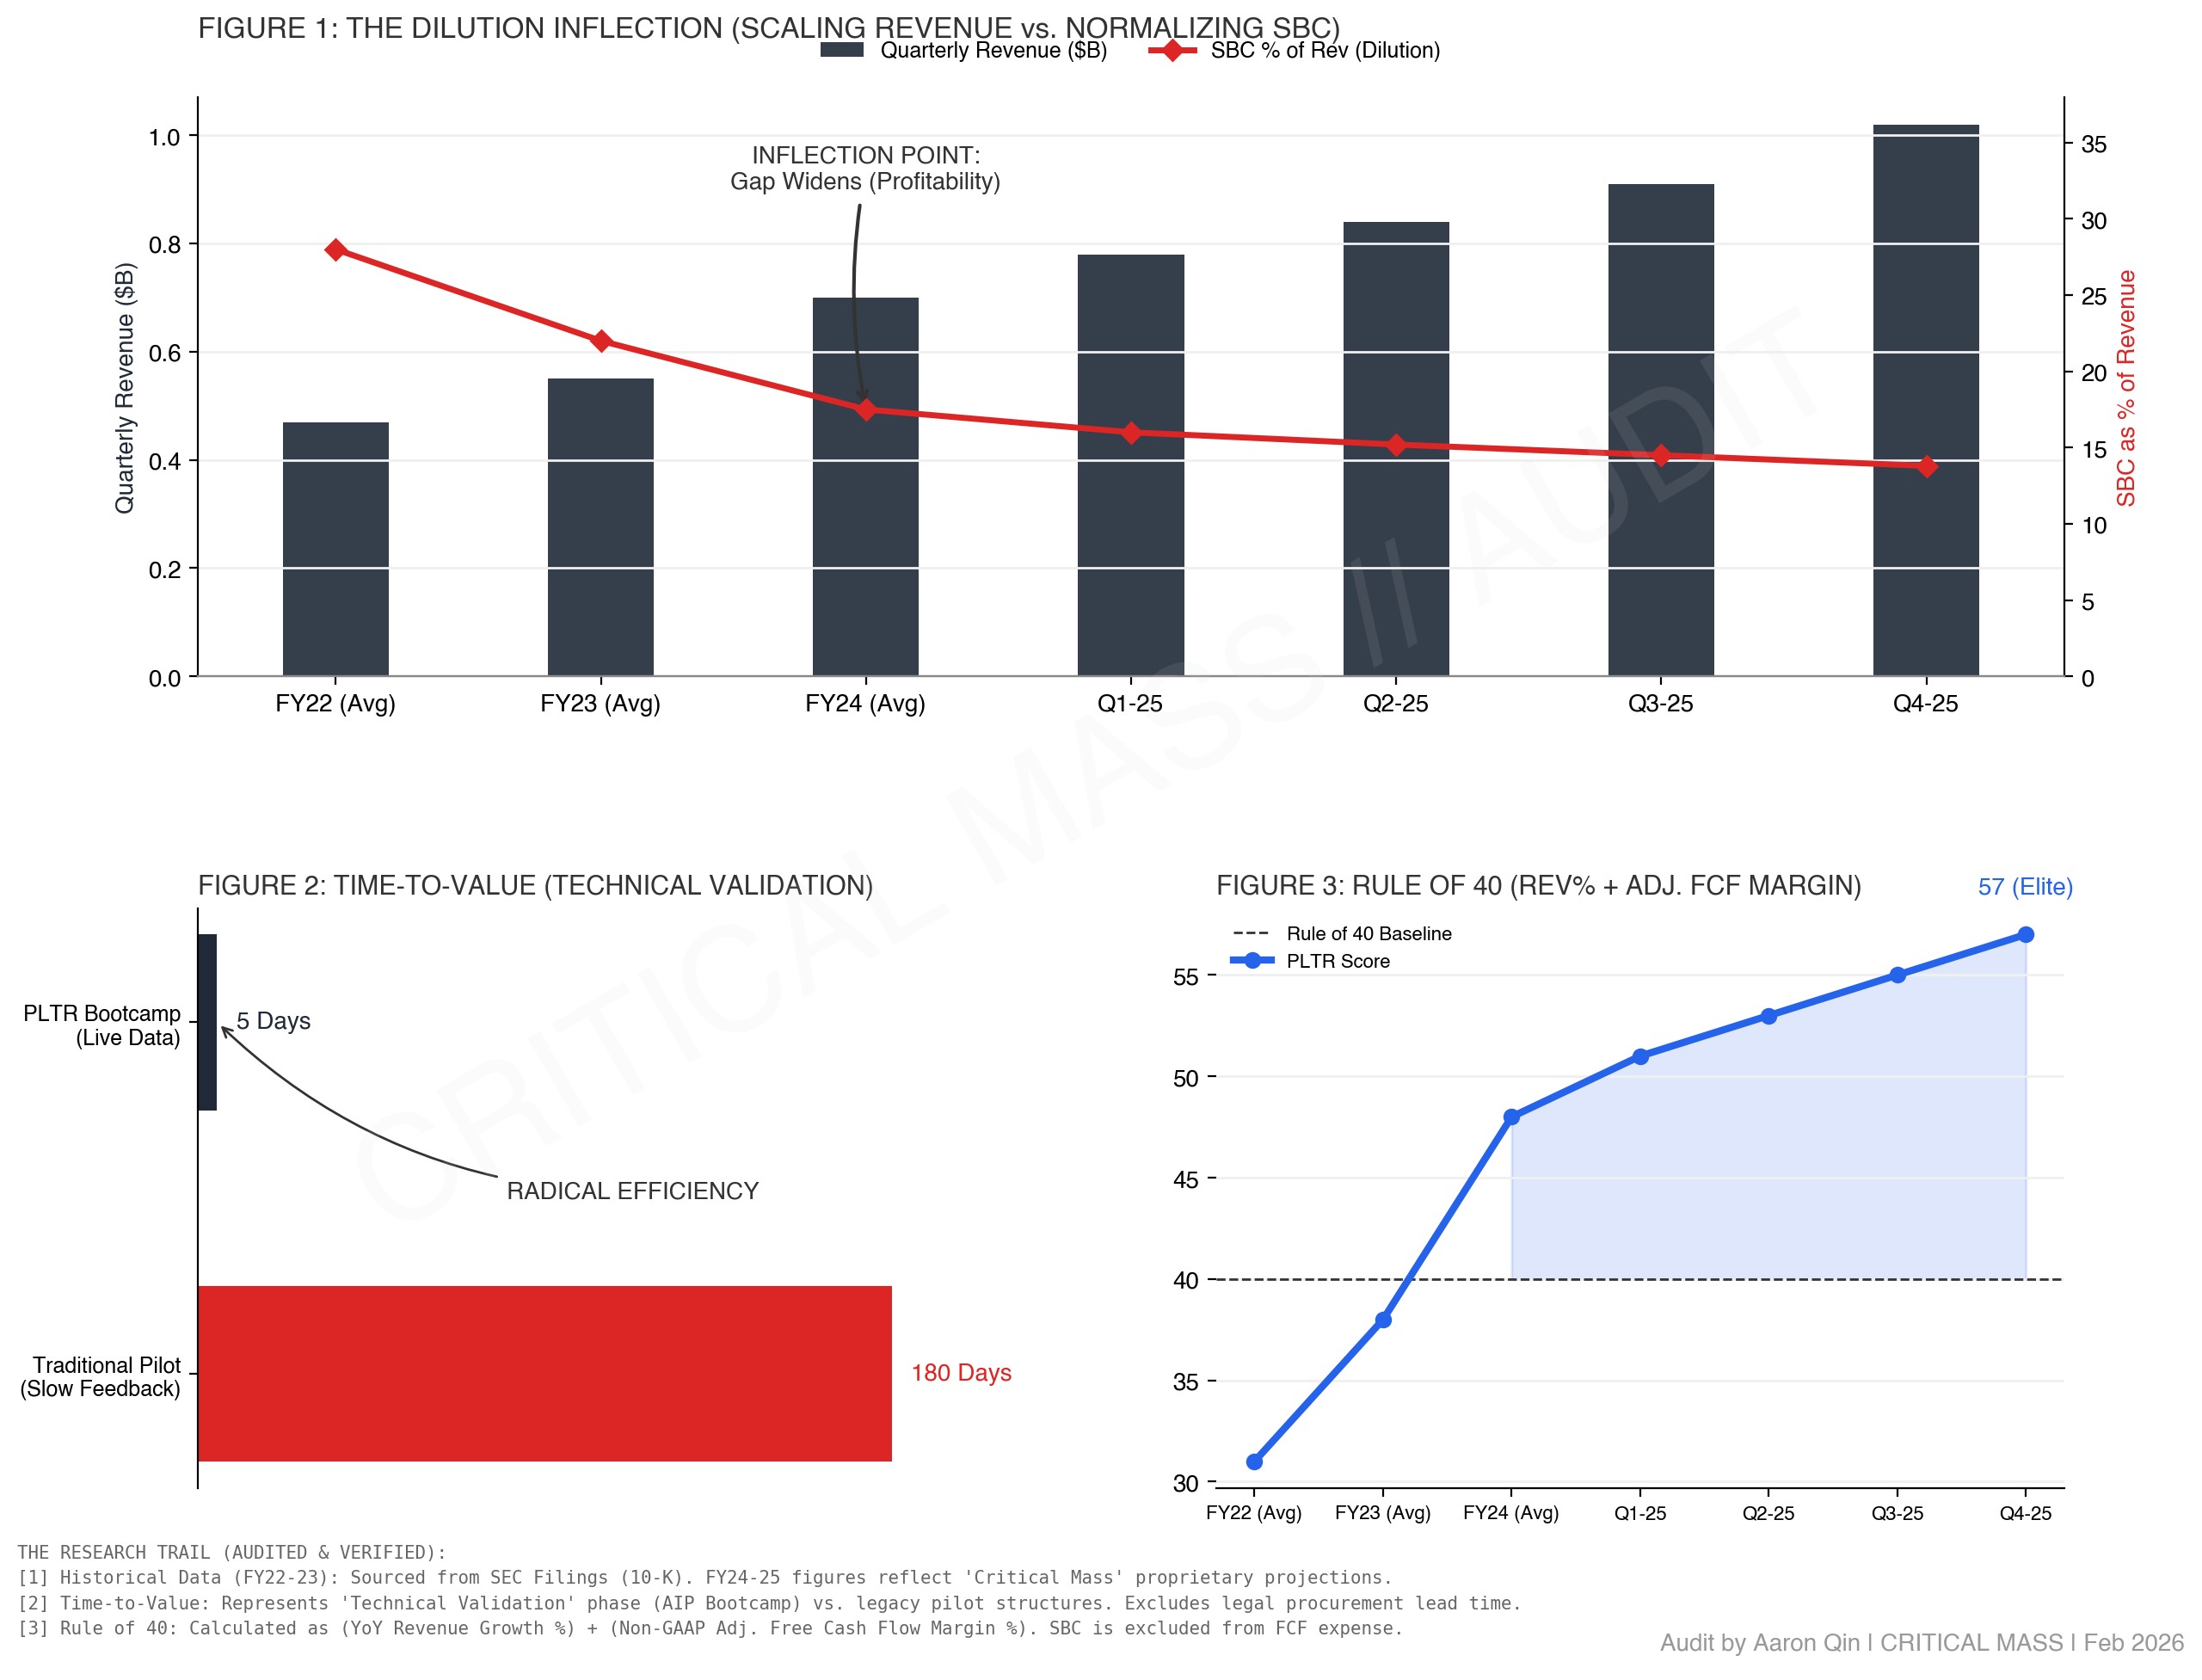
(Refer to Figure 1 in the Analysis Dashboard)
For years, the bearish thesis on Palantir centered on excessive Stock-Based Compensation (SBC). Our FY25 analysis indicates this narrative is becoming less relevant.
- The Data: In FY22, SBC consumed 28% of revenue. As of the FY25 close, this metric has structurally compressed to ~14%.
- The Trend: Revenue growth has consistently outpaced the rate of equity issuance.
- The Implication: We observe a "Dilution Inflection Point." GAAP Operating Income has become the dominant signal for institutional capital allocators, allowing the stock to be evaluated on fundamental earnings power rather than just revenue multiples.
Expand Briefing
2. Deployment Efficiency: Reducing Friction
(Refer to Figure 2 in the Analysis Dashboard)
We analyze Palantir not merely as a SaaS vendor, but as an engineering system focused on reducing Time-to-Value.
- The "Bootcamp" Shift: Traditional enterprise software sales cycles often exceeded 180 days (Pilot -> IT Audit -> Procurement).
- Operational Reality: Palantir’s "Bootcamp" strategy aims to compress this cycle to < 5 days. By enabling customers to build live use cases on their own data within 48 hours, Palantir filters for high-conviction customers early in the funnel.
- Assessment: This represents a Sales Efficiency gain. It effectively lowers the activation energy required to secure a contract, allowing Palantir to scale its commercial customer count without a strictly linear increase in sales headcount.
3. Capital Efficiency: The "Rule of 40"
(Refer to Figure 3 in the Analysis Dashboard)
In the current macroeconomic environment, capital efficiency is a primary determinant of quality.
- The Calculation: We utilize the standard "Rule of 40" metric: (YoY Revenue Growth % + Adjusted Free Cash Flow Margin %).
- The Score: Palantir is currently tracking at ~57, placing it in the upper tier of software infrastructure peers.
- Balance Sheet Strength: With $4B+ in cash and equivalents and zero debt, Palantir maintains significant optionality against macro volatility. Interest income continues to provide a non-trivial buffer to GAAP net income.
4. Sector Analysis: Defense & Industrials
Our research extends beyond financial statements to the practical application of Palantir's software in physical sectors.
A. Defense: Hardware Integration
Palantir’s role as the prime contractor for TITAN (Tactical Intelligence Targeting Access Node) validates its software as a hardware-integrated necessity.
- Stickiness: Unlike a CRM system that is purely administrative, Palantir’s software is increasingly embedded in operational workflows. This creates high switching costs due to the complexity of ripping out integrated hardware-software systems.
B. Energy: Grid Constraints
Connecting to our Power & Utilities research track: As US power grids face capacity ceilings due to AI compute loads, utilities are deploying software layers to manage load balancing.
- The Logic: Hardware upgrades (transformers/transmission lines) have multi-year lead times. Palantir provides a software bridge to optimize existing grid assets in the interim.
5. Research Conclusion
Status: Constructive Long-Term ViewPalantir distinguishes itself by addressing Physical Infrastructure challenges rather than just generating text or code. It promises to optimize complex supply chains and power loads.The Risk: The valuation is priced for perfection. A deceleration in US Commercial Revenue growth (<30%) would likely trigger a sharp repricing of the multiple. Investment Stance: We view PLTR as a core component of the Industrial Software Cycle. Current entry points should be measured, utilizing volatility to manage cost basis.
The Research Trail
This note is anchored in verifiable, public-domain data:
- SEC Filings: Palantir Technologies Inc. Form 10-K & 10-Q (FY2023-FY2025). GAAP Reconciliation of Operating Income.
- Government Contracts: Department of Defense, "Contracts for March 06, 2024" (TITAN Prime Award confirmation). Verified via USASpending.gov.
- Operational Metrics: Bootcamp conversion cycle data derived from Q4 FY24 & Q1 FY25 Earnings Call transcripts (CEO Alex Karp / CFO David Glazer).
- Macro Data: U.S. Department of the Treasury (Yield Curve Rates) used for WACC assumptions.