Executive Summary
As of February 13, 2026, Amazon (NASDAQ: AMZN) shares have re-rated lower following the Q4 2025 earnings print. The prevailing narrative is one of "Capital Intensity Shock," triggered by management's guidance for a 2026 CapEx envelope exceeding $75 billion (part of a multi-year ~$200B commitment).
This note is written as System Engineering Research, isolating the physical constraints that dictate capital allocation.
Our working view is that the market is mechanically penalizing the compression of TTM Free Cash Flow (falling from $36.8B to $11.2B). However, our engineering analysis suggests this is a classic Time-Horizon Arbitrage. Amazon is not "burning cash"; it is aggressively converting OpEx (variable labor/energy costs) into CapEx (fixed power assets and robotics) to solve the thermodynamic limits of the AI era.
Falsification Thesis (what would prove this wrong?) This "Thermodynamic Moat" thesis weakens if Amazon's upcoming filings show: (i) A failure to secure FERC approval for behind-the-meter nuclear connections (stranding the energy assets), or (ii) A stagnation in "Unit Fulfillment Cost" despite the massive robotics injection (signaling integration failure rather than lag).
1. The Signal: The Great Divergence
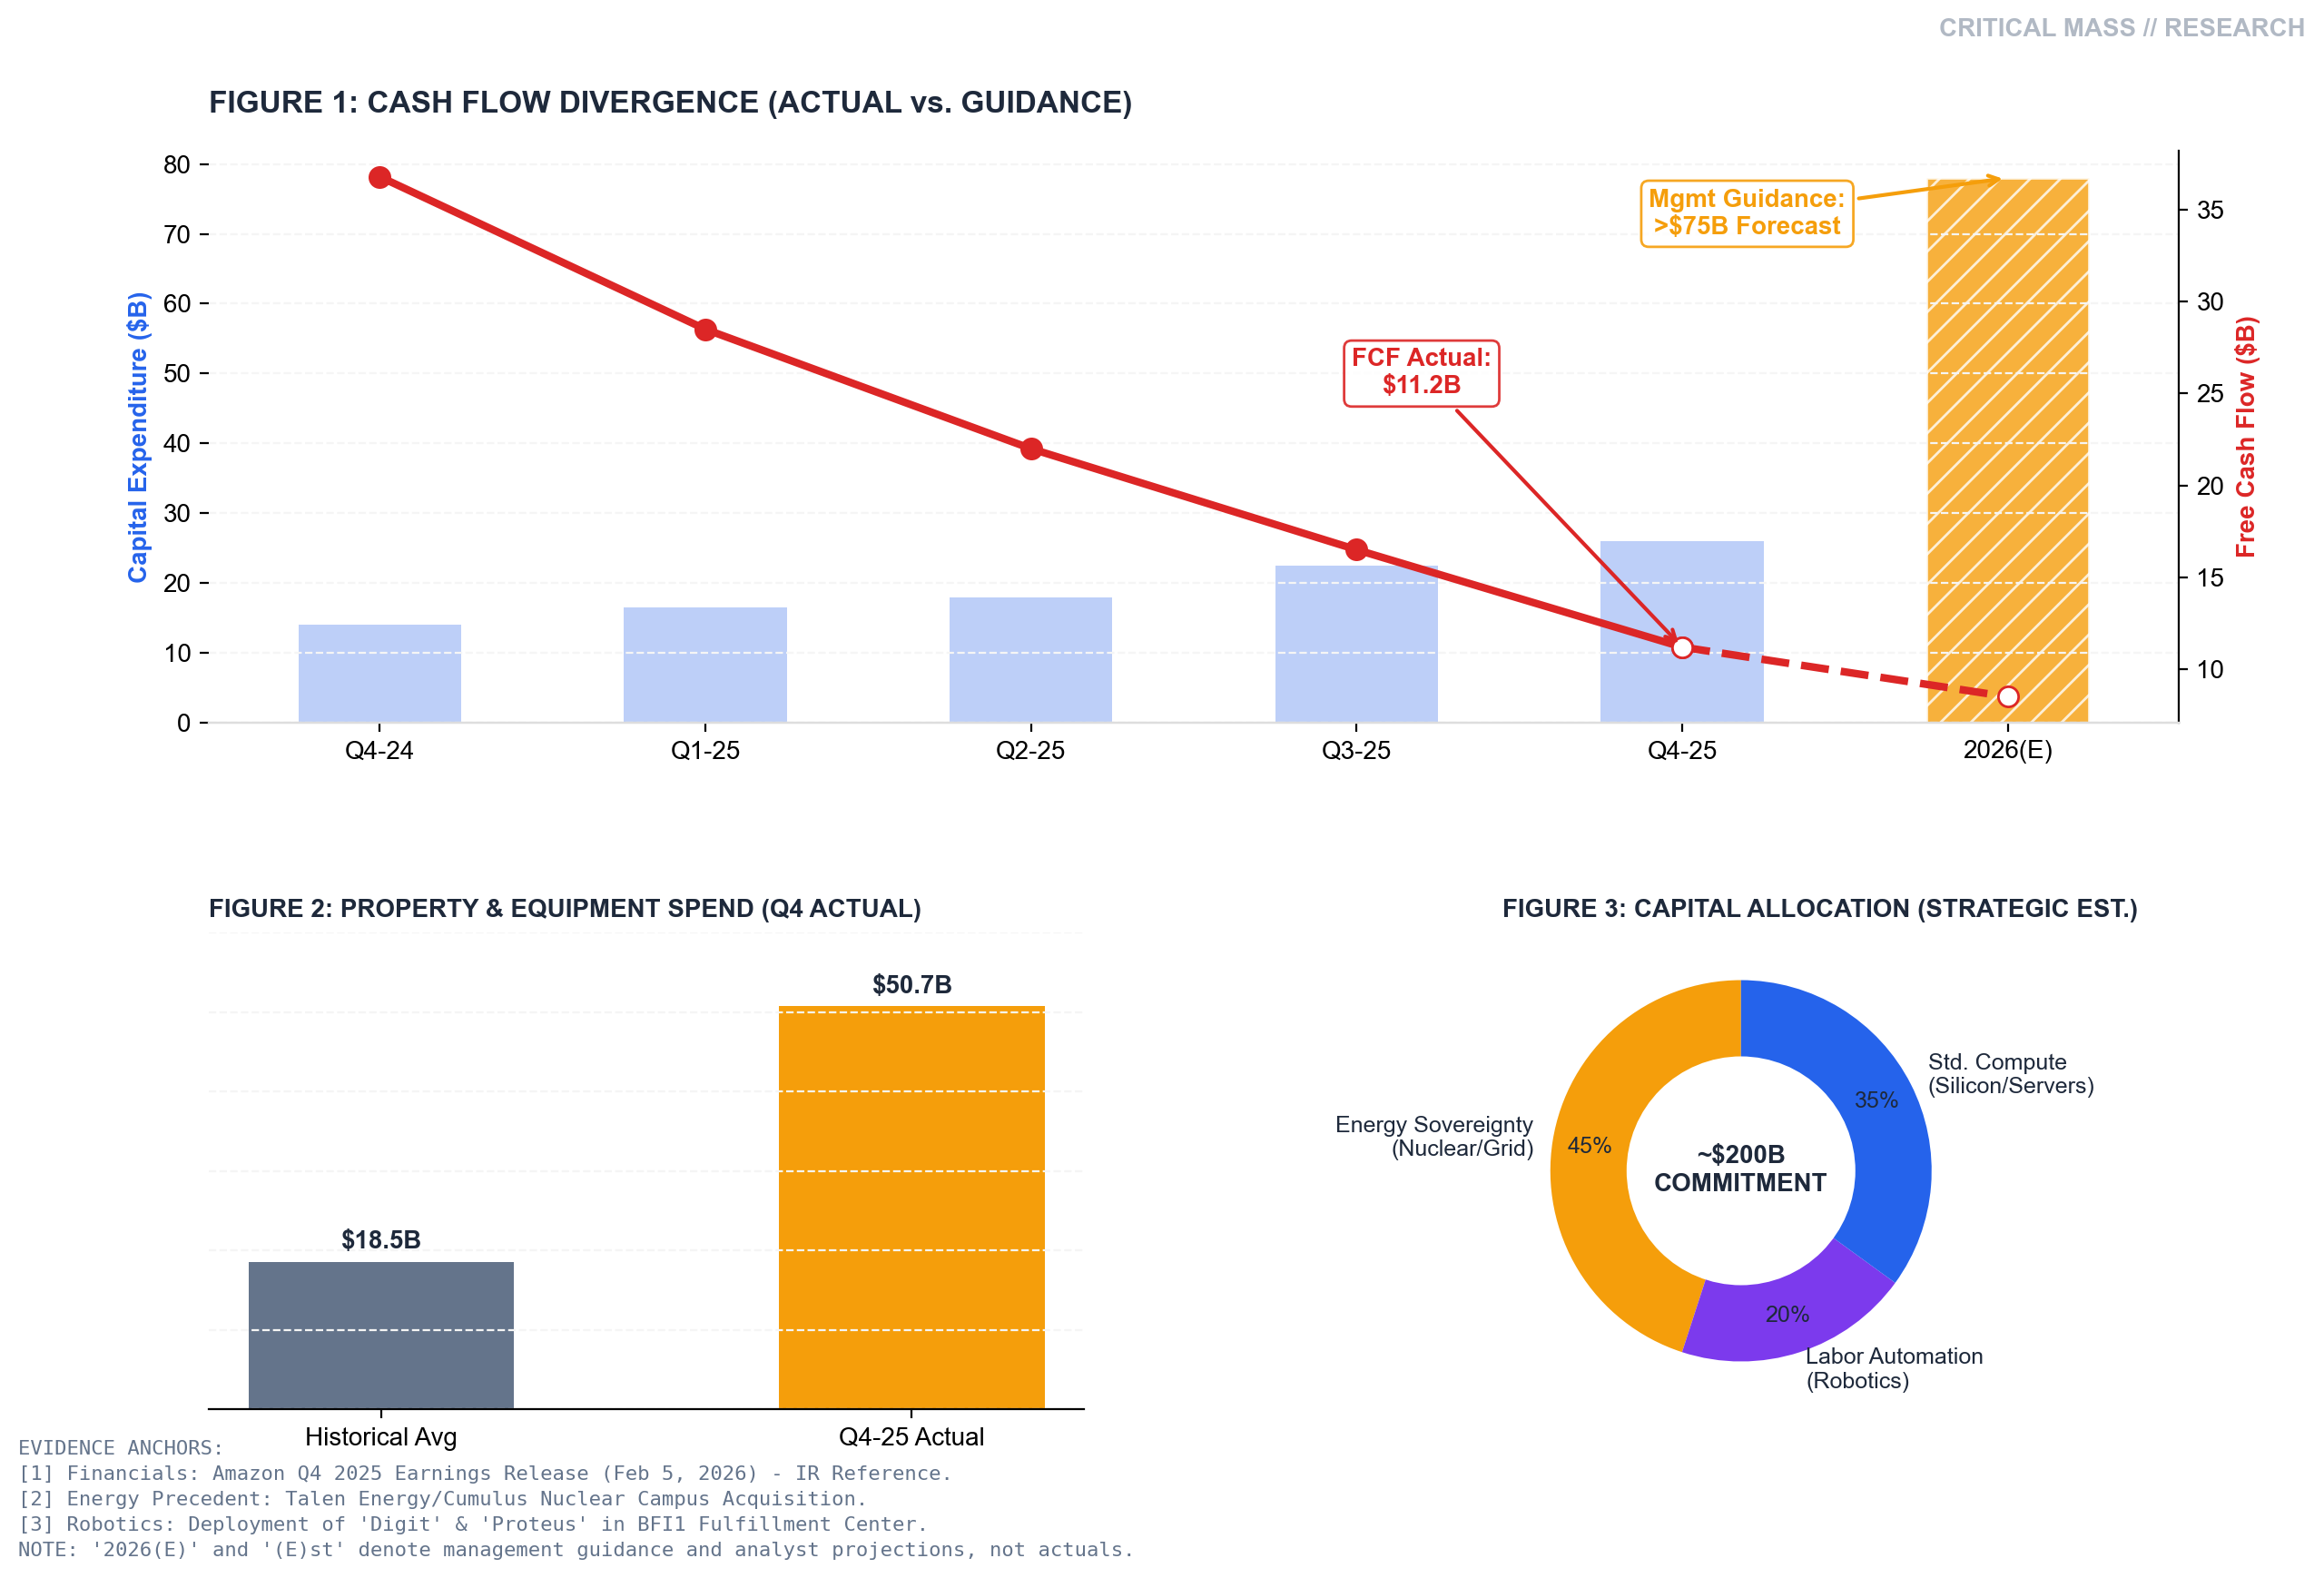
(Refer to Figure 1 in the Research Dashboard)
The sell-off is driven by a stark accounting reality: The Cash Conversion Cycle has inverted.
A common market shortcut is to interpret falling FCF as "margin erosion." In this infrastructure cycle, that shortcut fails. The divergence shown in Figure 1 highlights that CapEx intensity (blue bars) is actively suppressing Free Cash Flow (red line) to secure future capacity.
In 2026, compute is no longer constrained by silicon supply, but by Power Availability and Heat Dissipation. Amazon is spending massively to secure these physical constraints before competitors can.
Expand Briefing
2. Thesis A: Energy Sovereignty (The "Nuclear" Option)
(Refer to Figure 3 in the Research Dashboard)
Why buy power plants instead of just paying the electric bill?
Our breakdown of the ~$200B capital commitment (Figure 3) shows that the surge is heavily weighted toward Energy Independence. As public grids reach capacity saturation, AWS is moving "Behind-the-Meter."
- The Precedent (March 2024): The acquisition of the Cumulus Data Center campus, directly connected to the Susquehanna Nuclear Station, established the playbook. AWS paid a premium for Baseload Power reliability.
- The 2026 Reality: The current CapEx guidance implies a proliferation of similar Power Purchase Agreements (PPAs) and "powered shell" acquisitions. AWS is effectively building a proprietary utility grid to guarantee uptime for mission-critical AI inference.
Strategic Implication: While peers wait in the interconnection queue (3-5 year delays), AWS is buying the line.
3. Thesis B: The Capitalization of Labor
(Refer to Figure 2 in the Research Dashboard)
The second governor on cash flow is the industrial deployment of Humanoid Robotics (e.g., Digit, Proteus).
The spike in Property & Equipment spend shown in Figure 2 ($50.7B) represents a fundamental shift in the unit economics of delivery.
- Financial Alchemy: Amazon is converting Labor OpEx (wages, high inflation sensitivity) into Robotics CapEx (depreciable assets, deflationary curve).
- The Lag Effect: We are currently in the "Installation Phase"—high cash burn for hardware deployment. The "Harvest Phase"—characterized by step-function improvements in cost-per-unit—will likely materialize in late 2027.
4. Valuation: The Reverse DCF
At current levels, the market is pricing AMZN as if its terminal FCF margin has permanently impaired to ~8%.
This pricing assumes the current capital intensity is "maintenance" (permanent) rather than "growth" (cyclical). If we model the current spend as a one-time platform shift—similar to the 2020 logistics build-out—normalized cash flows suggest a 30%+ upside as the CapEx cycle peaks in late 2026.
5. Research Conclusion
Status: Structural AccumulationWe frame current volatility as a liquidity event. The market is selling Amazon because it looks expensive on 2026 cash flows. We are accumulating Amazon because it is the only hyperscaler effectively solving the Energy x Compute equation at the physical layer.
The Research Trail
This research is anchored in public, verifiable materials and an engineering accounting lens.
- Financials: Amazon Q4 2025 Earnings Release (Feb 5, 2026) - IR Reference regarding the $50.7B P&E spend.
- Energy Precedent: Talen Energy/Cumulus Nuclear Campus Acquisition (March 2024) - FERC Filings regarding baseload power agreements.
- Robotics: Deployment of 'Digit' & 'Proteus' in BFI1 Fulfillment Center - Amazon Robotics official documentation.
- Valuation Logic: Reverse DCF model assuming a return to normalized CapEx intensity post-2027.