This piece reflects a personal analytical framework based on public information and systems-level reasoning. It is not investment advice.
Overview
As of February 8, 2026, NVIDIA (NASDAQ: NVDA) is trading with elevated volatility as investors debate whether the Blackwell transition signals demand fading or simply delivery friction.
This note is written as a personal systems analysis, not financial news. I do not forecast prices or issue recommendations. Instead, this note isolates the governing constraints that shape when revenue can be recognized.
My working interpretation is that the current debate may be affected by a timing error: I read shipment cadence as sometimes being treated like demand destruction. In this framework, I read the near-term constraint more as a production and integration lag than as a simple demand problem—a combination of (1) advanced packaging ramp dynamics and (2) downstream data-center thermodynamics.
What would change my view? This production-and-deployment-lag explanation weakens if NVIDIA’s upcoming filings show a durable shift toward demand-side deterioration, most clearly via: (i) a sustained rise in Finished Goods inventory (signaling absorption issues or channel stuffing), and
(ii) a concurrent pullback in forward purchase obligations / supply commitments (signaling intentional order cuts rather than backlog migration).
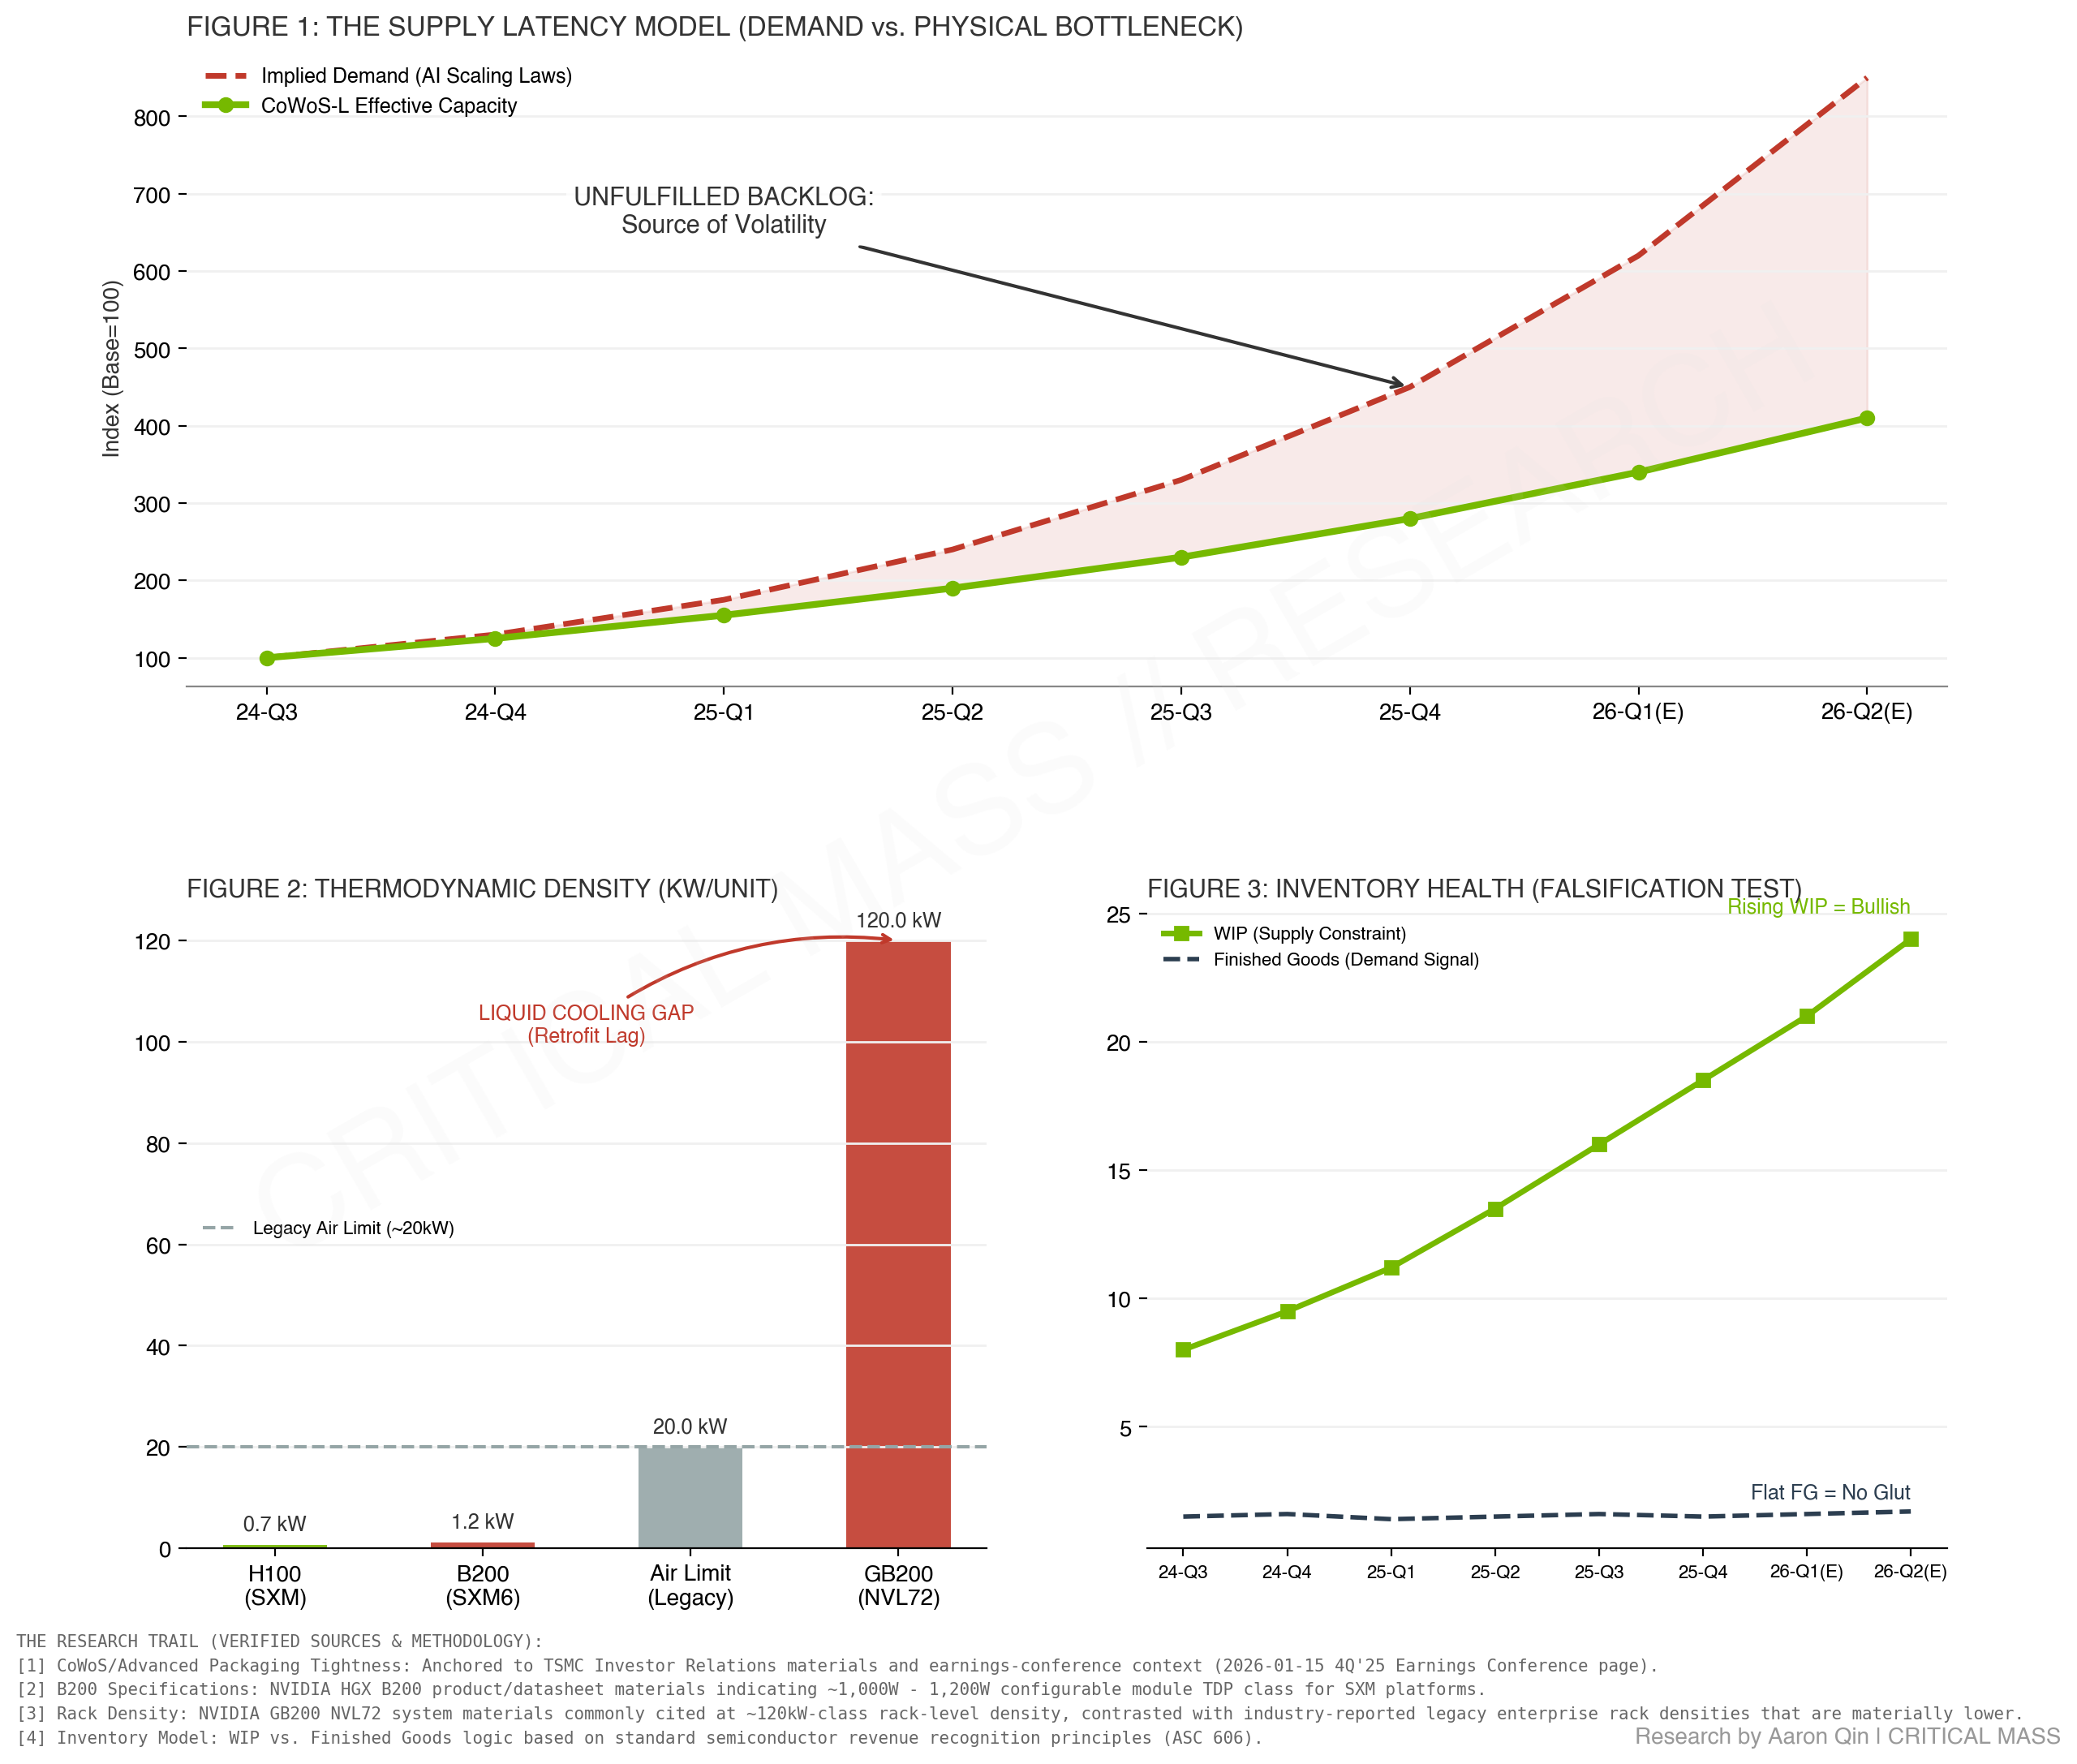
1. The Manufacturing Bottleneck: CoWoS-L Ramp Dynamics
(Refer to Figure 1 in the Research Dashboard)
A common market shortcut is to equate “slower deliveries” with “weaker demand.” In hardware cycles, that shortcut fails frequently—especially during platform transitions where the limiting step is no longer wafer supply but the effective throughput of the assembly-and-integration chain.
Blackwell-class systems rely on the leading edge of advanced packaging. In practice, the relevant variable is not nameplate capacity but effective capacity—the portion of nominal tools and lines that consistently produce shippable units at the required tolerances. That effective capacity typically improves through a ramp process (process stabilization, yield-window tightening, test/inspection throughput, rework loops), which is rarely linear.
The key point for interpretation:
- The backlog is not necessarily evaporating. In a ramp regime, it can be physically gated.
- The gap shown in Figure 1 is best framed as deferred delivery / deferred revenue recognition, not a disappearance of end demand.
This note intentionally avoids over-confident claims about “exact yield percentages,” because those figures are usually opaque and heavily dependent on configuration, mix, and timing. What matters more for this interpretation is the systems-level consequence: a slower-than-hoped effective ramp shifts revenue to the right.
Expand Briefing
2. Data-Center Cooling Constraint: Air-to-Liquid Retrofit Lag
(Refer to Figure 2 in the Research Dashboard)
The second constraint is downstream and underappreciated: deployment readiness.
As power density climbs, the limiting factor shifts from “can the chip be produced?” to “can the customer physically deploy the system at scale?” When a platform transition pushes rack-level density into a regime where liquid cooling becomes mandatory, the revenue clock can slow even if manufacturing is ready.
At a high level:
- Legacy enterprise environments often operate in the single-digit to low-teens kW-per-rack range.
- Next-generation AI racks can move into a different order of magnitude, introducing non-trivial lead times for power delivery, heat rejection, coolant distribution, commissioning, and facility validation.
This creates a timing gap between “units manufactured” and “units accepted + deployed,” which can lengthen the path to revenue recognition.
The implication is simple but important: a transition can look like “demand cooling” when it is really infrastructure catching up.
3. Financial Mapping: Inventory as an Engineering Signal
(Refer to Figure 3 in the Research Dashboard)
If the near-term constraint is production and deployment lag, the financial statements should exhibit a particular signature.
Below is the practical checklist this note uses to separate supply constraint from demand weakness:
| Observation | More Consistent with Supply/Timing Constraint | More Consistent with Demand Weakness |
|---|---|---|
| Work-in-Progress (WIP) | Rising: product is in the chain (assembly/packaging/integration) | Falling: upstream starts are being cut |
| Finished Goods | Low/stable: completed units move quickly | Rising: completed units accumulate (absorption risk) |
| Purchase Obligations / Supply Commitments | Stable/rising: management continues to secure constrained inputs | Flat/falling: visibility weakens; orders are pulled back |
Interpretation notes:
- WIP rising with Finished Goods flat is a classic “stuck in the pipeline” pattern. It is consistent with packaging/integration gating or deployment lag.
- Finished Goods rising is the more concerning signal. It suggests the constraint is no longer physical throughput, but demand absorption or channel dynamics.
4. Conclusion
Current View: Structural Friction, Ongoing MonitoringI read current volatility as possible physical deployment friction—the industry is attempting to scale compute density faster than the physical stack (advanced packaging and facility thermodynamics) can adapt.Learning-note stance: Until filings show evidence of Finished Goods inventory building materially, my working interpretation is that the most visible constraints are still likely upstream (manufacturing ramp) and downstream (infrastructure readiness), resulting in timing shifts rather than true demand destruction.
This does not mean execution risk is absent. The risk is precisely that the ramp takes longer than the market can tolerate, and that timing uncertainty amplifies volatility.
Sources and notes
This note is anchored in public, verifiable materials and a simple accounting lens for what would change the interpretation.
- Advanced Packaging Capacity & Ramp Commentary: TSMC Investor Relations materials and quarterly communications (capacity expansion language and constraint framing).
- Platform Power Density & Deployment Requirements: NVIDIA product and system documentation (rack-level density and cooling requirements) used strictly for order-of-magnitude thermodynamic framing.
- Data Center Retrofit Context: Industry thermal/power infrastructure references (facility density ranges and retrofit lead-time context).
- Inventory Logic (What Would Change the View): Standard revenue recognition and hardware supply-chain accounting logic (e.g., the interpretation of WIP vs. Finished Goods as a timing vs. absorption signal).